Art that integrates data visualizations can help bridge the US political divide over climate change

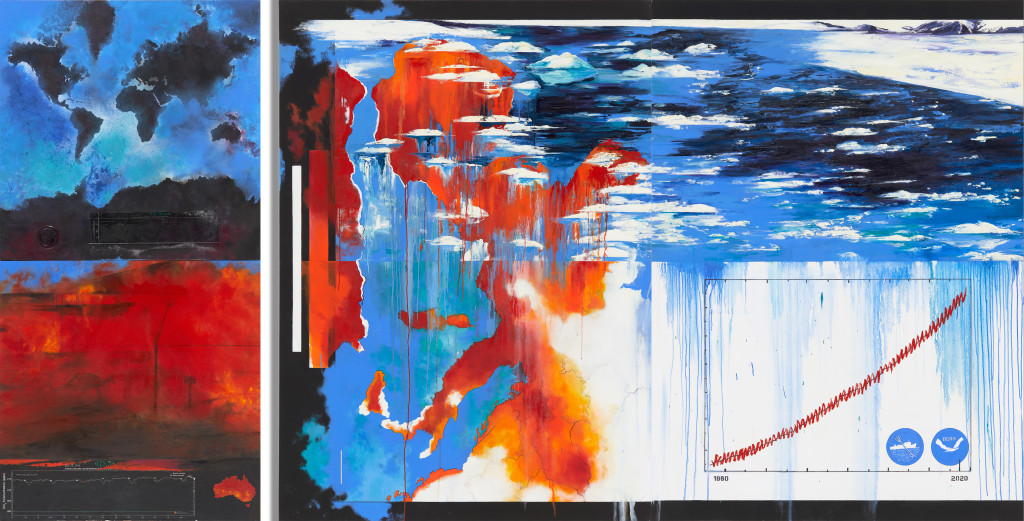
A painting by Diane Burko entitled “Summer Heat, 2020” depicts red, orange and blue motifs of wildfires and melting glaciers that overlap with maps that appear to drip over a graph of global atmospheric carbon dioxide levels. Research from the University of Wisconsin–Madison has shown that combining climate data with visually engrossing art can make data more meaningful to viewers and bridge political divides related to climate science. Painting by Diane Burko
Communicating science to a general audience can be challenging. Successfully conveying research on polarizing topics such as climate change can be even more difficult.
But a new study from University of Wisconsin–Madison researcher Nan Li shows that intentionally integrating art with data visualizations can help non-expert audiences more meaningfully engage with climate change while also bridging political divides in ways that data alone cannot. In fact, data graphs on their own can exacerbate political division on climate change.
As an assistant professor in the Department of Life Sciences Communication, Li studies how innovative visual representations of science can shape people’s understanding and opinions about various scientific issues. Li teamed up with Isabel Villanueva, Thomas Jilk and Dominique Brossard from UW–Madison and Brianna Rae Van Matre from EcoAgriculture Partners to survey the responses of people across the political spectrum to a painting by Diane Burko entitled “Summer Heat, 2020.”
The painting depicts red, orange and blue motifs of wildfires and melting glaciers that overlap with maps that appear to drip over a graph of global atmospheric carbon dioxide levels. It’s not just art and science side-by-side or pretty colors added to a graph; the two are combined to tell a larger story that makes people stop and think about climate change.
Li thinks this intentional integration of the data into the piece of art is part of its success.

Nan Li
“In order for art to maximize its potential as a tool for public engagement, you really need to use it as a catalyst for triggering self-reflection,” Li says. “People use this piece of art as a starting point to think about what this all means to themselves.”
For the study, published in Communications Earth & Environment, 671 survey participants from across the U.S. were divided into groups and shown four different presentations of the painting and data it contains: the original painting, a detailed version of the graph it includes, a simplified version of that same graph and an edited version of the painting with a detailed graph.
In the first iteration of the survey, participants were instructed ahead of time to reflect on the meaning of and emotions evoked by the visuals. Survey participants who saw the paintings reported stronger positive emotions — like happiness, awe, inspiration and hope — than participants who were shown just the graphs.
The researchers then used a digital editing tool to represent what it would look like if “Summer Heat, 2020” and other visuals were posted to an Instagram feed. The caption contained more details about the painting and facts about climate change.
Participants felt the artwork post was as credible a source of information as the data graphs post. Li says this finding supports the idea that galleries aren’t the only way these kinds of artwork can be successful, but that bringing them to a larger audience through social media is beneficial as well.
In general, when people see graphs about climate change, whether they identify as liberal or conservative influences how they perceive the relevance of the issue. But in the new study, Li’s team saw that the gap between political affiliations was reduced when survey participants saw the painting in a social media format. In other words, when liberals and conservatives both see artistic representations of climate data rather than data alone, they are more likely to share the perception that climate change is relevant to them.
Another iteration of the survey did not instruct participants to reflect on the meaning and emotions the visuals inspired before seeing them. Participants viewed the simulated Instagram posts and then later reported their perceived relevance of climate change. This time, participants’ perceived relevance of climate change was equally polarized along their political ideology despite the different visuals they were shown. To Li, this suggests that priming people for introspection is important for breaking down political barriers.
While the findings are exciting, Li also recognizes this case study is very specific. The study is limited to the use of one painting in one style from one artist.
Moving forward, she and her team hope to complete additional studies that tease out what element of a piece makes communicating the scientific information more successful. They want to expand the study to consider reactions to other styles by artists from other backgrounds and survey reactions of people in other countries. Li and her team also highlight that it’s important for scientists and artists to be aware of their audience’s interest level in art and recognize that not everyone will react emotionally or cognitively to a piece in the same way.
Even though communicating these polarizing concepts can be challenging, Li believes in the ability of art to bridge the gap between a lay audience and scientific data.
“When you show art, I think it sort of makes people think, ‘Hey, wait a minute. What is this all about?’” Li says. “It fills in people’s imaginative deficit of what data means without taking a lecturing approach. It actually engages people to explore the meaning themselves.”


